Introduction: Why Contours Matter
Designing a building without understanding the land is like drawing in the dark. For architects, engineers, planners, and real estate developers, contour maps are more than just lines on paper — they reveal the rise and fall of the earth. These maps unlock critical terrain information that shapes everything from building orientation to stormwater drainage, foundation design, and even project viability.
Yet many professionals still struggle to read them correctly.
This comprehensive guide breaks down everything you need to know — from what contour lines represent, to how to interpret them, and finally, how to apply contour data in real-world design scenarios. Whether you’re designing on a hillside or preparing for site grading, this is the only resource you’ll need.
What is a Contour?
A contour is an imaginary line that connects points of equal elevation on the earth’s surface. These lines form the backbone of topographic maps, allowing us to represent the three-dimensional shape and slope of the land in a two-dimensional format.
Contours help depict important land features like hills, valleys, and depressions. When drawn below water, they’re called submarine contours or bathymetric curves.
The spacing of these lines reveals the terrain:
- Close lines = steep slopes
- Wide lines = gentle slopes
On a map, these lines show how high or low the ground is — and how steep or flat it gets.
Think of a contour line as the intersection between a horizontal plane and the terrain below. While contour lines aren’t visible in nature, shorelines are a real-world example — they follow a constant elevation, just like a contour.
What is a Shoreline?
A shoreline is the boundary or edge where land meets a body of water — such as a lake, sea, pond, or ocean.
In simple terms:
The shoreline is where the water ends and the land begins.
Why is it important in contour mapping?
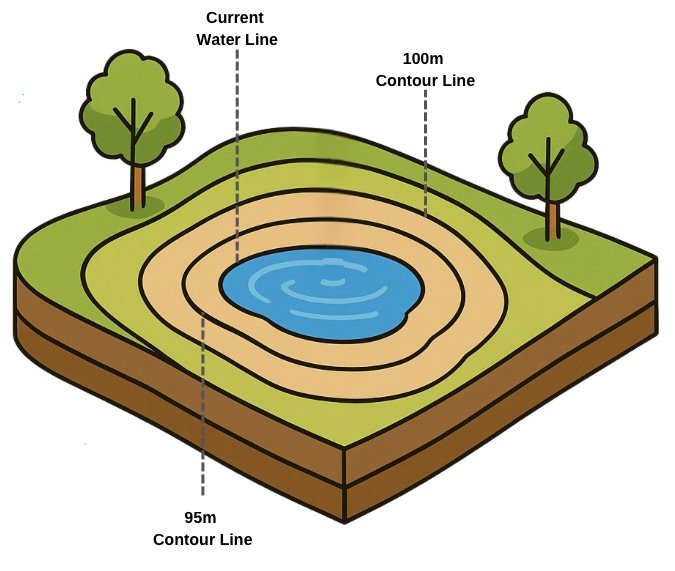
A shoreline naturally follows a contour line because the water surface is level. For example:
- If a pond’s water level is at 100 meters elevation, then the entire shoreline lies along the 100-meter contour line.
- As the water rises or falls, the shoreline moves — tracing out new contour lines at each level.
While contour lines are not physically visible on land, they help us visualize elevation changes. Imagine slowly draining a pond. Each drop in water level creates a new shoreline. That edge is a contour line.
Shorelines vs Contours
| Feature | Shoreline | Contour Line |
| What it shows | Water’s edge at a moment in time | Points of equal elevation |
| Visibility | Visible in nature | Imaginary (drawn on maps) |
| Example | Edge of a lake | Line showing all 100m elevation points |
| Relationship | Follows a real elevation level | Represents that level across terrain |
Types of Contour Lines
Contour lines are categorized based on how they appear on maps:
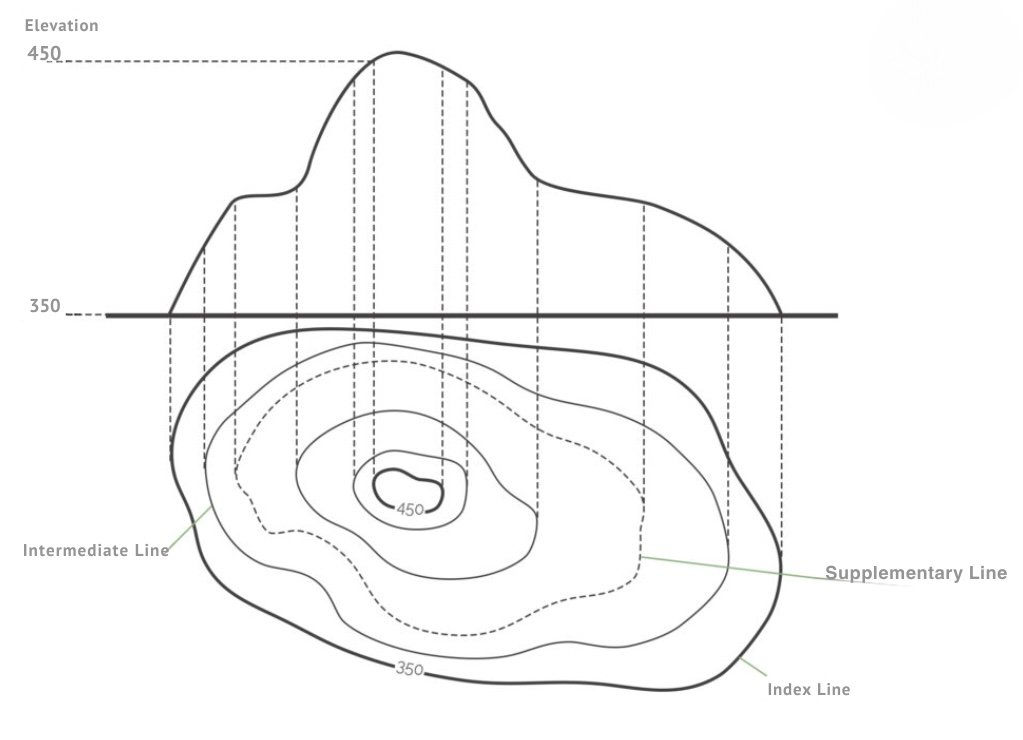
1. Index Contour Lines
- Bold or thicker lines, labeled with round elevation numbers (e.g., 100, 200).
- Appear at regular intervals (e.g., every 5th line in a 1m interval map).
2. Intermediate Contour Lines
- Standard, thinner lines between index lines.
- Show gradual elevation change (e.g., 101, 102, 103 between 100 and 105).
3. Supplementary Contour Lines
- Dashed or dotted lines used in very flat terrain.
- Represent minor elevation changes that wouldn’t show clearly with standard intervals.
What is a Contour Interval?
A contour interval is the vertical distance or difference in elevation between two consecutive contour lines on a map. It plays a crucial role in representing the relief and slope of the land in a two-dimensional format.
- A uniform contour interval ensures consistency and accuracy in how terrain is interpreted.
- A larger contour interval is used for steep terrain or large-scale maps.
- A smaller contour interval offers more detailed information, especially in flatter areas or for detailed site planning.
Example:
If contour lines on a map show elevations of 100m, 102m, and 104m — the contour interval is 2 meters.
Key Factors Affecting Contour Interval
Several factors influence the selection of an appropriate contour interval:
1. Scale of the Map
- Large-scale maps (e.g., 1 cm = 10 m): Smaller contour intervals (e.g., 0.5 – 1 m)
- Small-scale maps (e.g., 1 cm = 100 m): Larger intervals (e.g., 5 – 15 m)
This prevents clutter and makes maps readable.
| Terrain Type | Large Scale (1cm = 1–10m) | Intermediate Scale | Small Scale (1cm = 100m+) |
| Flat | 0.2–0.5 m | 0.5–1.0 m | 1.0–3.0 m |
| Rolling | 0.5–1.0 m | 0.5–1.5 m | 2.0–5.0 m |
| Hilly | 1.0–1.5 m | 1.5–3.0 m | 5.0–15.0 m |
2. Purpose of the Map
- Town planning / Landscaping: Smaller intervals for accuracy (0.5–2 m)
- Road or railway alignment: Up to 2 m
- Geological surveys: 6–15 m
3. Nature of the Ground
- Flat terrain requires smaller intervals to show subtle slopes.
- Steep or mountainous areas use larger intervals to avoid overcrowding of lines.
4. Time and Budget
- Larger contour intervals save survey time and reduce cost.
- Smaller intervals require more data collection and are used when precision is critical.
Why Contour Lines Cannot Cross
Contour lines represent a single elevation. If two lines were to cross, it would mean that a single point on the ground is at two different elevations — which is physically impossible.
Exceptions:
- Lines may merge or touch in case of a vertical cliff or wall.
- Contour lines can appear very close together but will never actually intersect unless in vertical terrain representations.
What is Horizontal Equivalent?
The horizontal equivalent refers to the horizontal ground distance between two adjacent contour lines. It varies with slope: shorter in steep areas, longer on gentle slopes. It’s calculated as:
Horizontal Equivalent = Contour Interval ÷ Gradient
Example:
If contour interval = 1 meter and gradient = 1 in 20,
then horizontal equivalent = 1 ÷ (1/20) = 20 meters
What is a Contour Gradient?
A contour gradient refers to the slope between two elevations, expressed as the ratio of vertical rise or fall to the horizontal distance.
- It shows how steep or gentle the terrain is.
- The gradient can be rising or falling, depending on the direction of movement.
Formula:
Gradient = Vertical Height ÷ Horizontal Distance
Expressed as 1 in X (e.g., 1 in 100)
Examples:
- A canal drops 1 meter in 100 meters = Gradient of 1 in 100
- A railway track rises 1 meter over 250 meters = Gradient of 1 in 250
What are Grade Contours?
Grade contours are imaginary or plotted lines on a map that maintain a constant slope (gradient) across the terrain. They help in planning paths, such as roads, railways, or canals, that must follow specific slope limits for safety and functionality.
How it Works:
Let’s say you’re designing a road with a safe descent gradient of 1.5 in 30 and a 1-meter contour interval.
You calculate how far horizontally you need to travel to drop 1 meter:
Horizontal Distance = 30 ÷ 1.5 = 20 meters
So, for every 1-meter drop in elevation, the road would move 20 meters horizontally, and that path is called a grade contour.
Benefits of Using Grade Contours:
- Ensure safe, consistent slopes
- Allow multiple design options (more than one alignment may be possible)
- Ideal for infrastructure that must adhere to slope restrictions (like roads, canals)
What Contour Maps Don’t Cover?
Contour maps exclude vegetation and surface cover details like trees, shrubs, or grass. Such data is typically included in full topographic or landscape survey.
| Not Covered in Contour Maps | Why? |
| Trees, shrubs, vegetation | Not related to elevation |
| Utility structures (manholes, drains) | Outside scope of elevation data |
| Poles, fences, streetlights | Minor elevation impact, omitted |
| Detailed building layout | Requires architectural/site plan |
| Property or land ownership lines | Covered in legal/cadastral maps |
| Underground elements (pipes, cables) | Not measurable by surface contours |
| Temporary/movable objects | Irrelevant to terrain slope analysis |
Key Contour Terminology
| Term | Meaning |
| Contour Interval | Vertical distance between two contour lines |
| Index Line | Thick, bold contour line labeled with elevation |
| Intermediate Line | Standard line between index lines (not always labeled) |
| Supplementary Line | Dotted lines used in very flat terrain to show minor elevation changes |
| Horizontal Equivalent | Ground distance between two contour lines |
| Contour Gradient | Slope between two contour lines, expressed as rise/run or % |
| Ridge | A series of contours forming an elongated hill |
| Valley | A U or V-shaped depression in terrain |
| Saddle | A low point between two hills |
How to Read a Contour Maps (With Interpretation Tips)

Reading a contour map is like learning to “see” the land without stepping on it that is seeing the landscape in 3D using 2D lines. Each contour line connects points of equal elevation and gives insight into shape and slope of the terrain.
1. Understand Line Spacing
Spacing tells you about the steepness of the land:
| Contour Spacing | Terrain Type |
| Close lines | Steep slope or cliff |
| Wide lines | Gentle slope or flat land |
| Even spacing | Uniform slope |
2. Learn the Meaning of Contour Shapes
Contours form patterns that represent real-world terrain
| Shape | What It Indicates |
| Concentric circles | A hill or mound (elevation increases inward) |
| Concentric with hachures | Depression (elevation decreases inward) |
| V-shape pointing uphill | Valley or stream (water flows down) |
| V-shape pointing downhill | Ridge or spur |
| Hourglass shape | Saddle (low area between two hills) |
| Overlapping/very tight lines | Cliff or very steep terrain |
3. Check the Contour Interval
This is the vertical distance between two adjacent contour lines (e.g., 1m, 2m, 5m):
- Found in the map legend or scale.
- A smaller interval gives more detail (used for flat terrain).
- A larger interval is used for steeper, rugged terrain.
4. Recognize Elevation Trends
Use contour labels to:
- Determine high and low points
- Understand where water will flow (always perpendicular to contour lines and downhill)
5. Practice with Real Terrain Features
Contour maps help identify:
- Hills
- Plateaus
- Valleys
- Slopes
- Depressions
Look for patterns and use a key or legend to decode them quickly.
Quick Reading Tips:
- Always follow the numbers — contours are labeled to show elevation.
- Index lines are thicker and labeled — use them as reference points.
- Water flows downhill — perpendicular to contours, never along them.
- Elevation increases as you move uphill (inward on hills, outward in depressions).
- Watch out for false interpretations: flat-looking wide areas may still have gradual slopes.
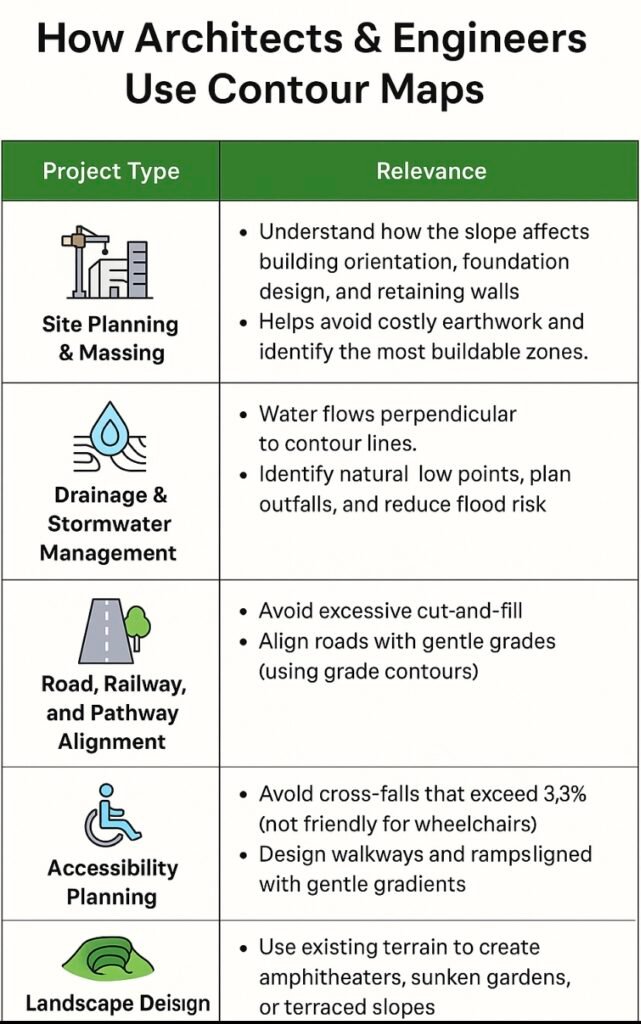
How Architects & Engineers Use Contour Maps
Contour maps aren’t just for reading terrain — they drive real design decisions:
Site Planning & Massing
- Understand how the slope affects building orientation, foundation design, and retaining walls.
- Helps avoid costly earthwork and identify the most buildable zones.
Drainage & Stormwater Management
- Water flows perpendicular to contour lines.
- Identify natural low points, plan outfalls, and reduce flood risk.
Road, Railway, and Pathway Alignment
- Avoid excessive cut-and-fill.
- Align roads with gentle grades (using grade contours).
Accessibility Planning
- Avoid cross-falls that exceed 3.3% (not friendly for wheelchairs).
- Design walkways and ramps aligned with gentle gradients.
Landscape Design
- Use existing terrain to create amphitheaters, sunken gardens, or terraced slopes.
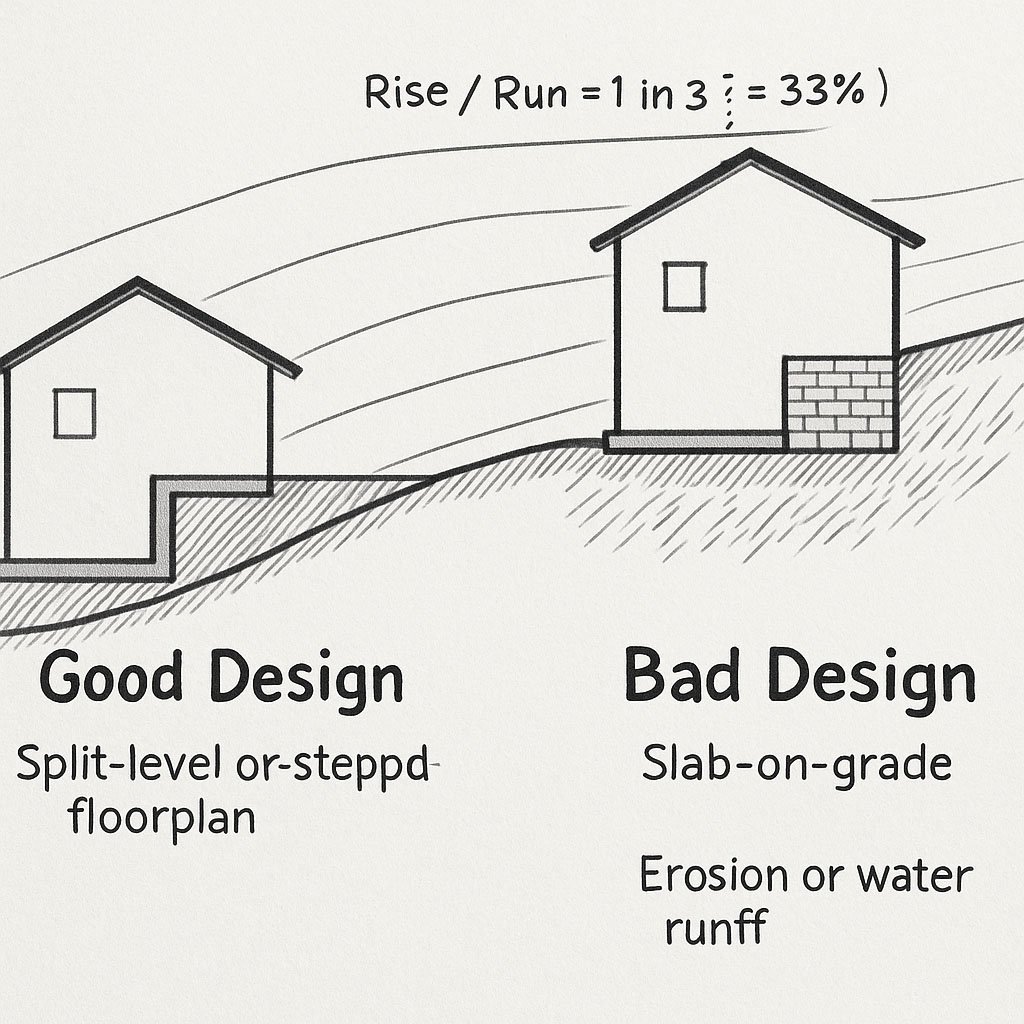
Example: Designing on a Sloped Site
Scenario: You have a plot where the elevation changes from 102m to 112m over a 30m span.
- Contour Interval: 1m
- No. of contours: 11
- Gradient = Rise/Run = 10/30 = 1 in 3 = 33%
In this case:
- Site is not suitable for slab-on-grade.
- Requires split-level design or retaining wall system.
- Drainage planning is essential to prevent erosion or waterlogging.
How to Calculate Contour Gradient
Formula:
Gradient = Vertical Height / Horizontal Distance
- Example: If elevation rises 2m over 40m → Gradient = 1 in 20 = 5%
Slope Color Code (for visualizing terrain):
| Gradient (%) | Terrain Type | Color |
| 0–2% | Flat | White |
| 2–5% | Gentle | Yellow |
| 5–10% | Moderate | Orange |
| 10–15% | Steep | Brown |
| 15%+ | Very steep/cliff | Red |
Tools & Equipment Used for Contour Mapping
| Tool | Purpose |
| Total Station | Measures angles and distances with high accuracy |
| GNSS/GPS Receivers | Accurate elevation data using satellites |
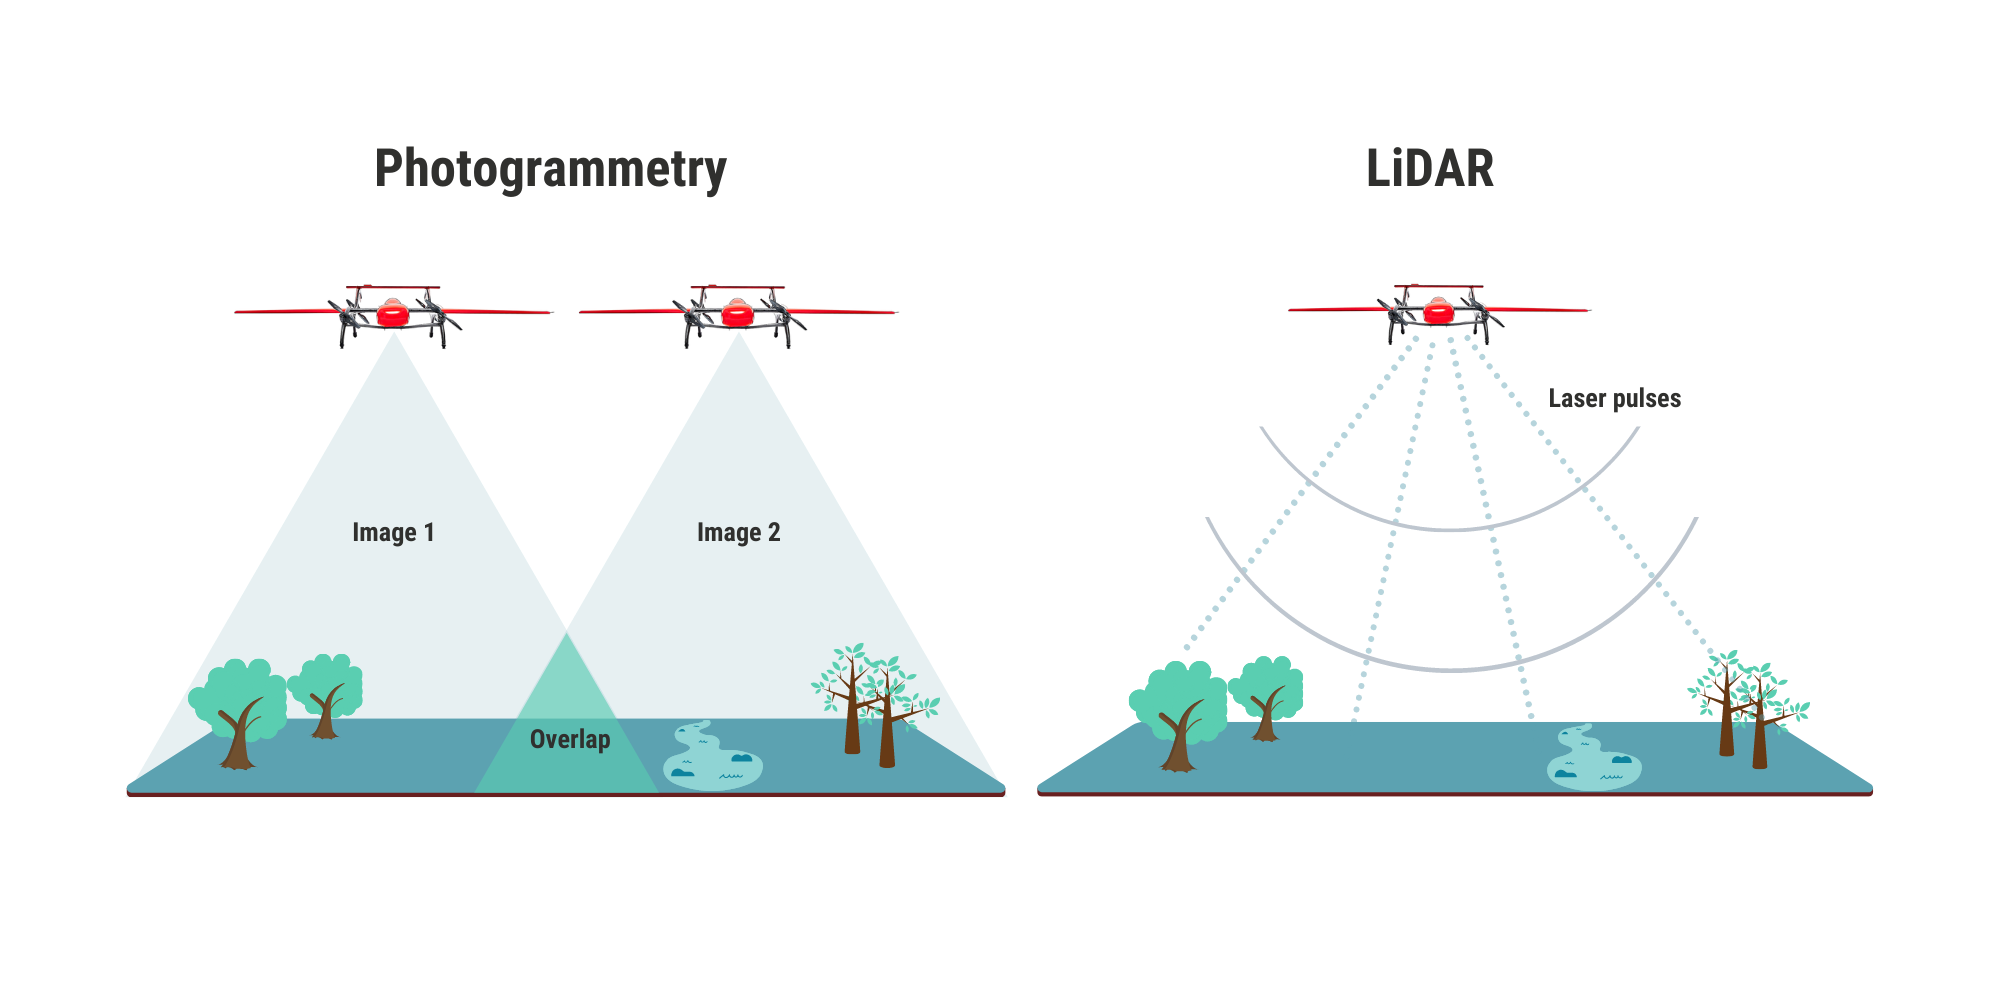
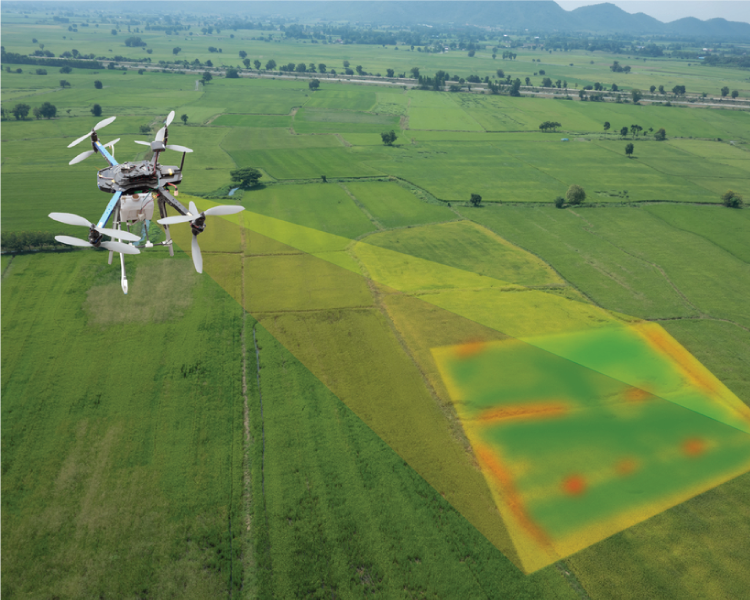
| Drone + Photogrammetry | High-speed data collection over large terrain |
| LiDAR Scanners | High-resolution 3D terrain models |
| AutoCAD / GIS Software | Draft and analyze the final contour maps |
Explore our drone-based topographic survey services to capture accurate contour maps.
Real-World Use Cases of Contour Maps
Architecture & Landscape Design
- Site grading, levels, setbacks, building orientation
Civil Engineering
- Road design, bridge elevation, drainage alignment
Real Estate Planning
- Feasibility of plot development, risk zones, earthwork budgeting
Environment & Conservation
- Flood risk zones, watershed mapping, erosion-prone areas
Urban Planning
- City zoning, greenbelt management, slope-based zoning laws
Related Blogs
Frequently Asked Questions (FAQs)
A contour line connects all points of equal elevation on a map, showing the terrain’s shape.
Closely spaced contour lines indicate a steep slope; widely spaced lines indicate a gentle slope.
They inform decisions about site design, drainage, accessibility, and structure placement — reducing risk and cost.
No, unless representing a vertical cliff. Normally, each line must represent a distinct elevation.
Typically 0.25–1 meter depending on the terrain’s complexity and map scale.
No. Contour maps are for topographic understanding. For legal boundaries, a cadastral or boundary survey is required.